Excellent question!
The answer to this question depends on several factors:
- Rarity distribution
- Hours boosted
- Boost multiplier
- Super Rent Boost (SRB) frequency
- Badges owned
For this post, we will assume:
- Rarity distribution is average ($0.00000000158 per second)
- You boost for 24 hours a day
- SRB events run once a month for 64 hours
- Atlas Buck (AB) worth will be calculated over a period of 365 days
- AB must be spent to count
Below are the tables, alongside an explanation for the data.
Note: For non-USA, check for notes such as this one. There are some differences between the USA and non-USA version of Atlas Earth.
How To Read The Tables
Table 1 contains the yearly AB value for parcels. Each value listed is the destination for each given parcel tier and passport level.
For the first 150 parcels, the value you see is per parcel. Unlike other tiers (except for the last 2X row), you can buy parcels one at a time to receive the benefit.
For 220 to 1500 parcels, the value shown is for a single vertical jump from peak to peak. For example, if you have 150 parcels, you must purchase 70 additional parcels with 7000 AB to max out the 20X boost multiplier to receive the full benefit. If you happen to have 11 badges with your 150 parcels, then the value for the 70 parcels added is $0.00168826 per AB per year.
For 1500 to 1721 parcels, this is considered dead money. For all intents and purposes, you will receive effectively zero additional rent for this jump.
All parcels purchased beyond 1721 receives rent benefit.
Table 2 contains the yearly AB value for badges. Each value listed is the destination for each given parcel tier and passport level.
The value shown is for a single horiontal jump from peak to peak. For example, if you have 150 parcels and 1 badge, then if you spend 2000 AB to buy 10 additional badges, each AB spent in badges will produce an additional $0.00565062 per AB of yearly rent.
Table 2 includes an additional row for 40 parcels and several 2X rows. This is to show that ~40 parcels is the best time mathematically to purhase your first badge. Compare Table 1, 0 badges, 150 parcels and Table 2, 40 parcels, 1 badge. At 40 parcels, you get the same benefit for adding a badge as you do adding parcels at the 30X booster level. I also included a column for 0 badges for completeness.
Finally, if you would like to compare tables to decide if it’s mathmatically better to buy parcels or badges, look for the cell that corresponds to your current parcel and badge count. For example, if you currently have 150 parcels and 1 badge, then you should visually see $0.01661 for Table 1 and $0.05933 for Table 2. Then, in Table 1, move down vertically one step. You should see $0.00161 as the destination value. For Table 2, move horizontally to the right one step. You should see $0.00565 as the destination value. If you compare these two values, Table 2 produces the higher value. Thus, you should buy 10 badges (if you can). This is a better “investment” for your AB.
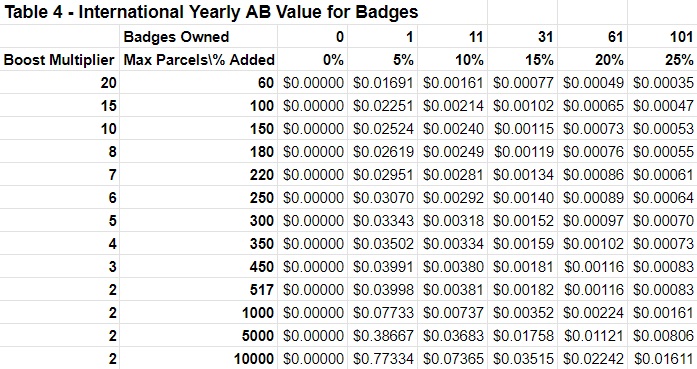
Note: non-USA should view Tables 3 and 4 for AB value for parcels and badges.
Table 1 – Yearly AB Value for Parcels
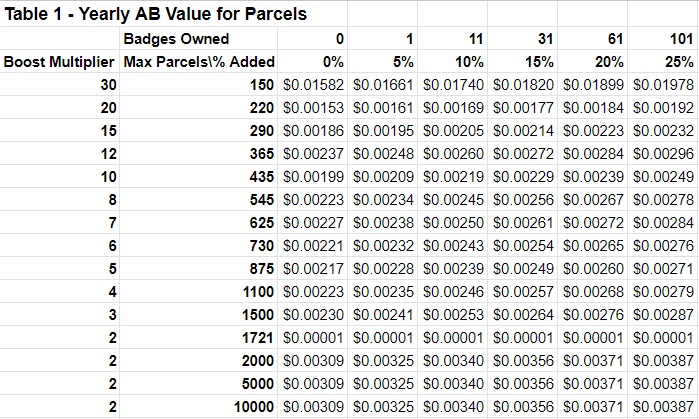
Table 2 – Yearly AB Value for Badges
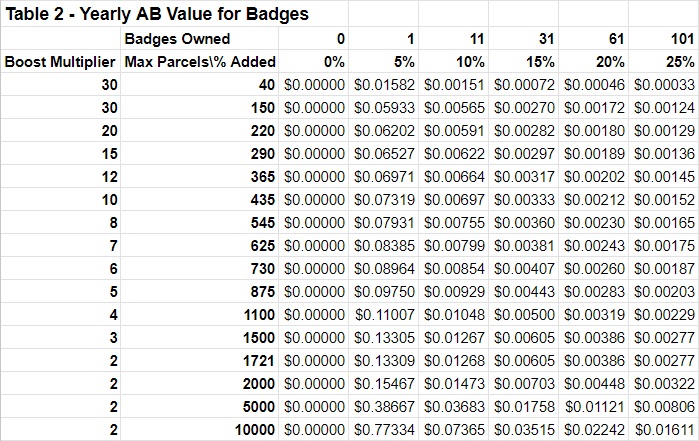
Table 3 – International Yearly AB Value for Parcels
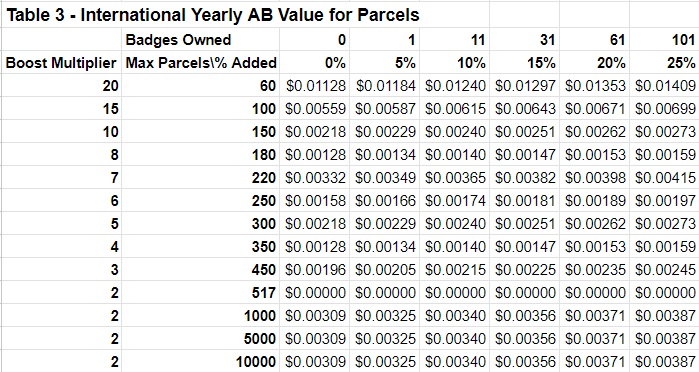
Table 4 – International Yearly AB Value for Badges
Formulas to Generate Tables
For those interested in examining the formulas I used to generate these tables, select https://docs.google.com/spreadsheets/d/1zbcJmVnrHxwXAzMiDsr2ld4ZOqs9po6SDsI_tjfwvy8/edit?usp=sharing. Included is an explanation for the data.
Special Thanks
Thank you to Matthew at https://atlasearthcalculator.com/ for vetting my math!
Updates:
05/16/2024 – Updated Canada to non-USA/International and updated tables to reflect new boost chart.
03/15/2024 – Updated page with Canadian notes and tables.
02/16/2024 – Updated post to reflect 64 hours SRB. Also, removed the entire “explanation of data” section to remove redundancy that exists in the spreadsheet.
11/05/2023 – Added an assumption that AB must be spent and another section to explain how to read the tables.
Leave a Reply